


Business decisions need data, not intuition. The Statistics module of Event365 provides monthly and annual totals, year-over-year comparisons, ranking of professionals and profitability analysis by event type. See which months are strong, which weddings bring the most margin, which professionals are most booked — and adjust prices, staff and marketing based on what really happens. Online dashboard, exportable and shareable with partners or shareholders.
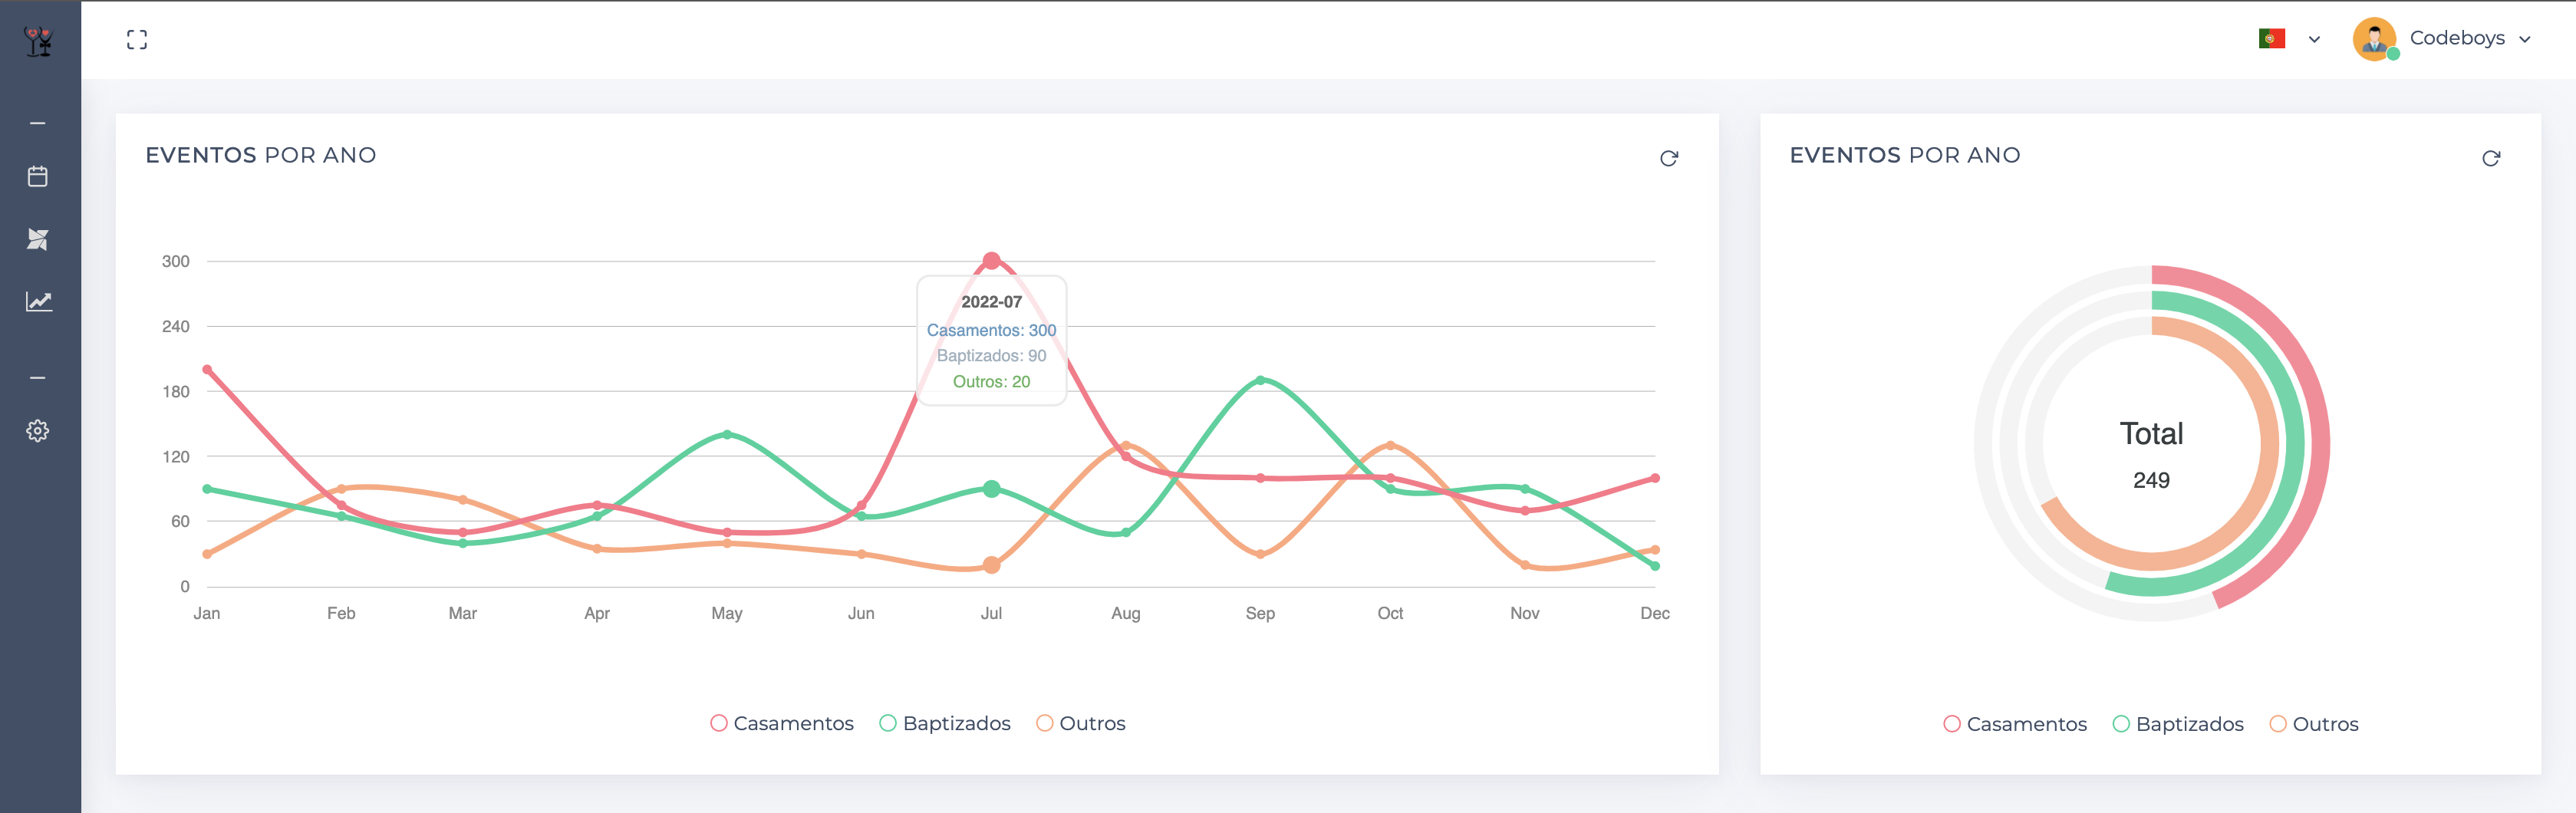
Comparative charts of Weddings vs Baptisms vs Others, with distribution pie chart and temporal evolution graph. Configurable start/end date filters.
Compare event evolution between 2 years side by side. Identify real seasonality, strong months and event types that are growing. Decide prices and marketing with data, not gut feeling.
Which professionals had the most bookings in the period? What is the aggregated cost of each? Useful to negotiate rates with regulars and identify who to keep always available.
Consolidated data in seconds, even with hundreds of events in history. Transparent cache — for the team, just "open and see". Accessible to Administrators via dedicated menu.
Free account, no card. Everything available during the trial period.
Create free accountWhere this feature makes the biggest day-to-day impact.
